Attribution Report
Holistic Attribution Capturing All Touchpoints
Kevel Audience uses all of the customer journey data to generate cross-channel, cross-device attribution reports.
The omnichannel customer journey data and first-party identity resolution in your Kevel Audience are an excellent foundation for more accurate attribution. It means we can link customer activity between devices and channels to a single attributable event, even if there are multiple sessions.
For example, if an email delivery, a Google search on mobile, and a direct session on desktop, all take place in within thirty minutes and all events are linked to the same customer ID, Kevel Audience can confidently identify all three events as one ‘session' with the attributable event being the email delivery.
The purpose of the Kevel Audience attribution reporting tool is to show how much revenue is generated by each source, medium, and campaign. Use these reports to decide how to allocate budgets most effectively.
Conversion Events
Kevel Audience will analyze the generated traffic in order to find conversion events and their respective attributable events:
-
Conversion event: an event that generated revenue, for example, an order placed.
-
Attributable event: a previous event from the user that lead to the conversion event.
Kevel Audience will relate conversion events with the attributable events that lead to the conversion and build these reports. You can see more details on how the conversion value is distributed across the attributable events here.
How to Generate an Attribution Report
Navigate to the attribution reports via the "Report" section of your left navigation. (1)
In this page, you can see an overview of the generated attribution reports, containing the time interval,
creation date, and current status of each report (2).
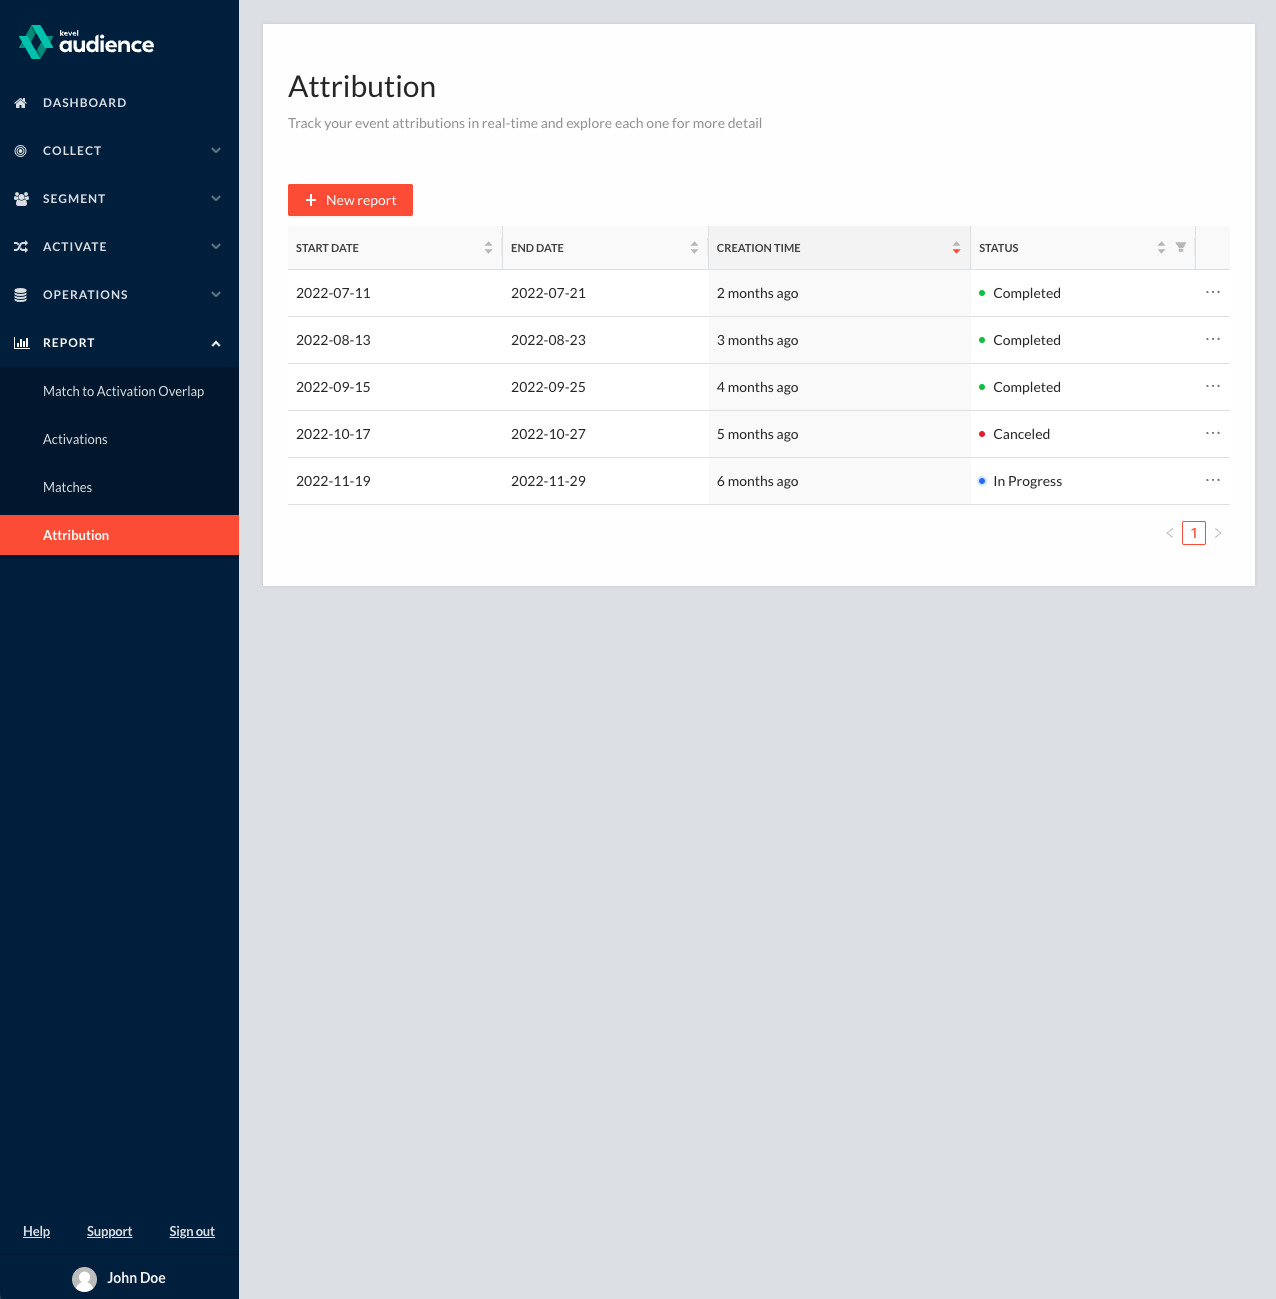
You will also see the "New Report" button above the list (3). Click it to navigate to the generation page.
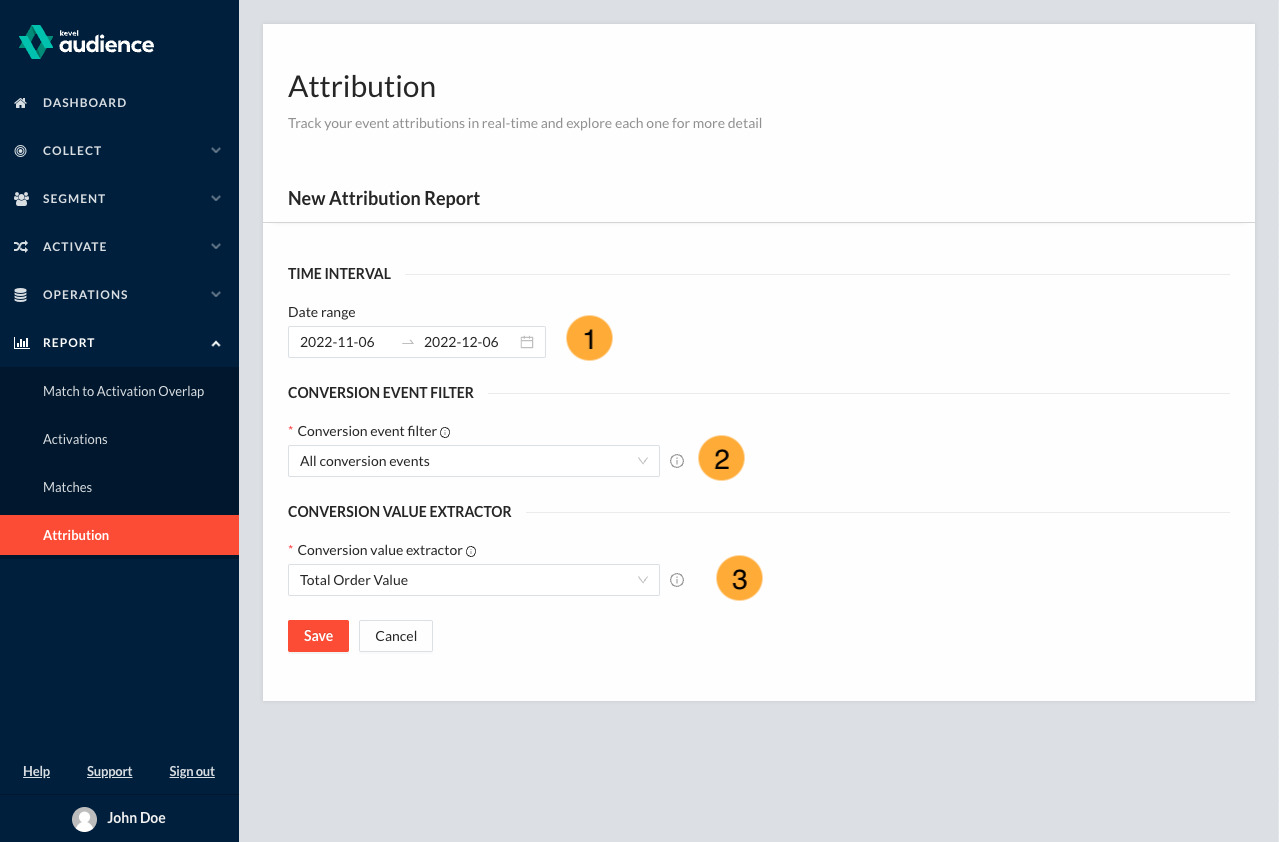
Report Generation Page
In the report generation page, you can configure three aspects of the report. First, you should select a start and end date (1)
for the report. Then, you can filter the conversion events you want to consider (2) on that timeframe and how we should extract the
value from each event (3). With this you can create reports for a subset of conversion events which are more specific and help you understand
what is driving conversions for example for a specific business unit, product category, or product. If you do not wish to filter the conversion
events nor configure the value extraction, you can leave these settings with the default value.
By default, we consider all the conversion events found in the specified timeframe and the order total as the value of the conversion.
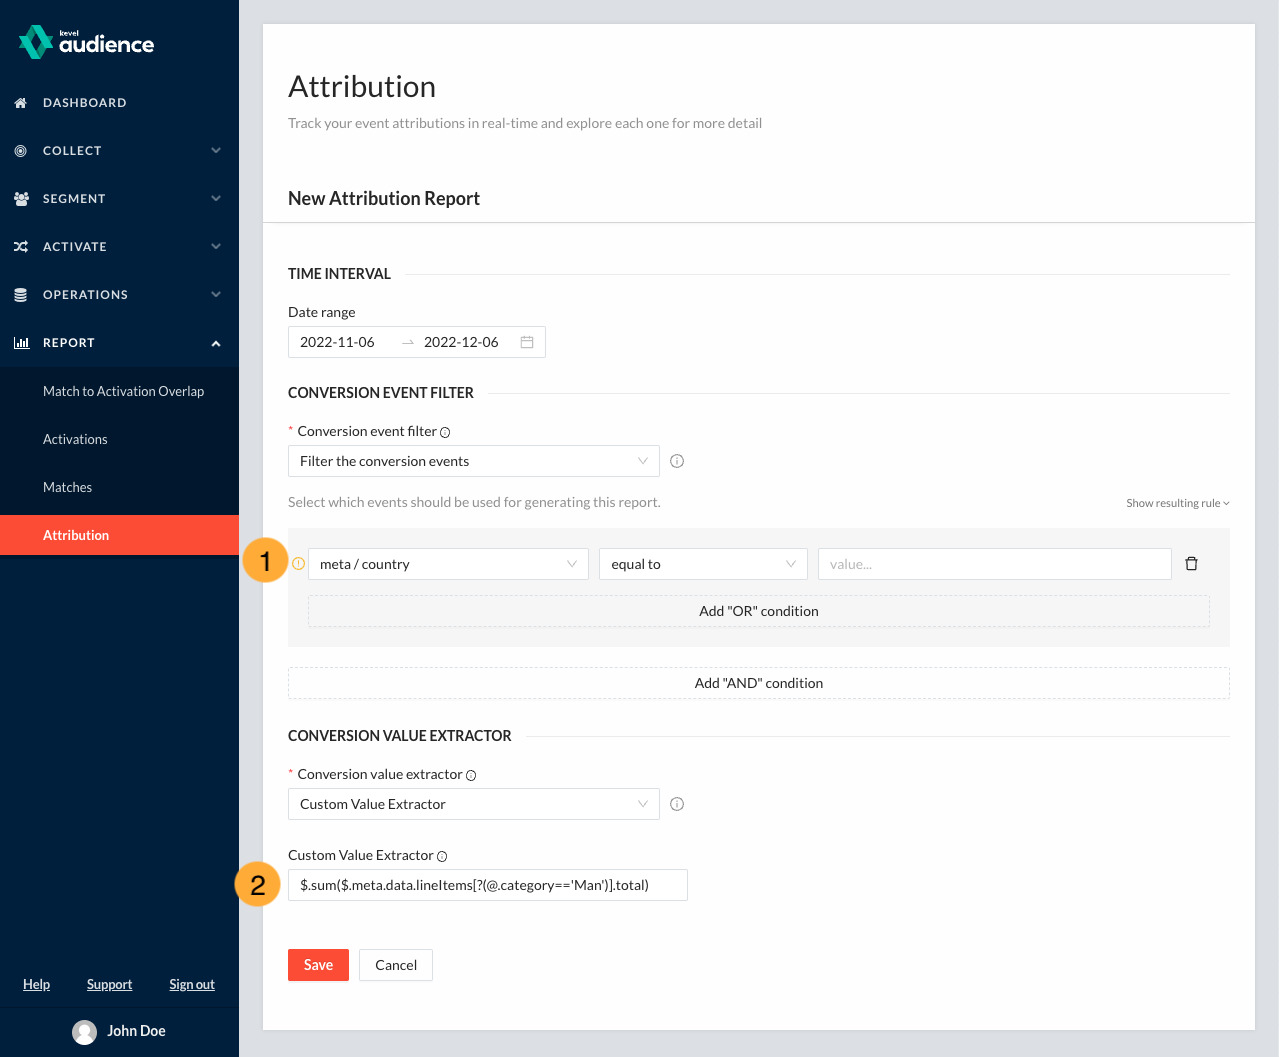
Generating Reports from Filtered Conversions
The event filter is based on a match rule, similar to the segment rules, where you can select which events
to consider based on the value of one or multiple fields from the event (1). Since we are filtering conversion events, these rules must be valid against
our orderPlace event schema, which you can see here.
The value extractor is built via a JSONPath expression, in which you can specify the events fields from which to extract the value and perform
arithmetic operations on those values (2) (once again, you should target fields present on the orderPlace event schema).
For example, considering you wanted to generate an attribution report with only conversion events from Portugal and consider only the value of order items from the category Man, you would require:
- a matchRule to filter the conversion events with the
countryfield set to Portugal; - a JSONPath expression that sums all the order
lineItemstotal value from the order event that have thecategoryfield set to Man, which can be expressed by the expression$..meta.data.lineItems[?(@.category == 'Man')].total.sum().
JSONPath expressions are built the same way as in custom value extractors in user attribute creation. For more information, refer to Value Extractors.
How to Read Your Attribution Report
-
Open a report to see an attribution overview
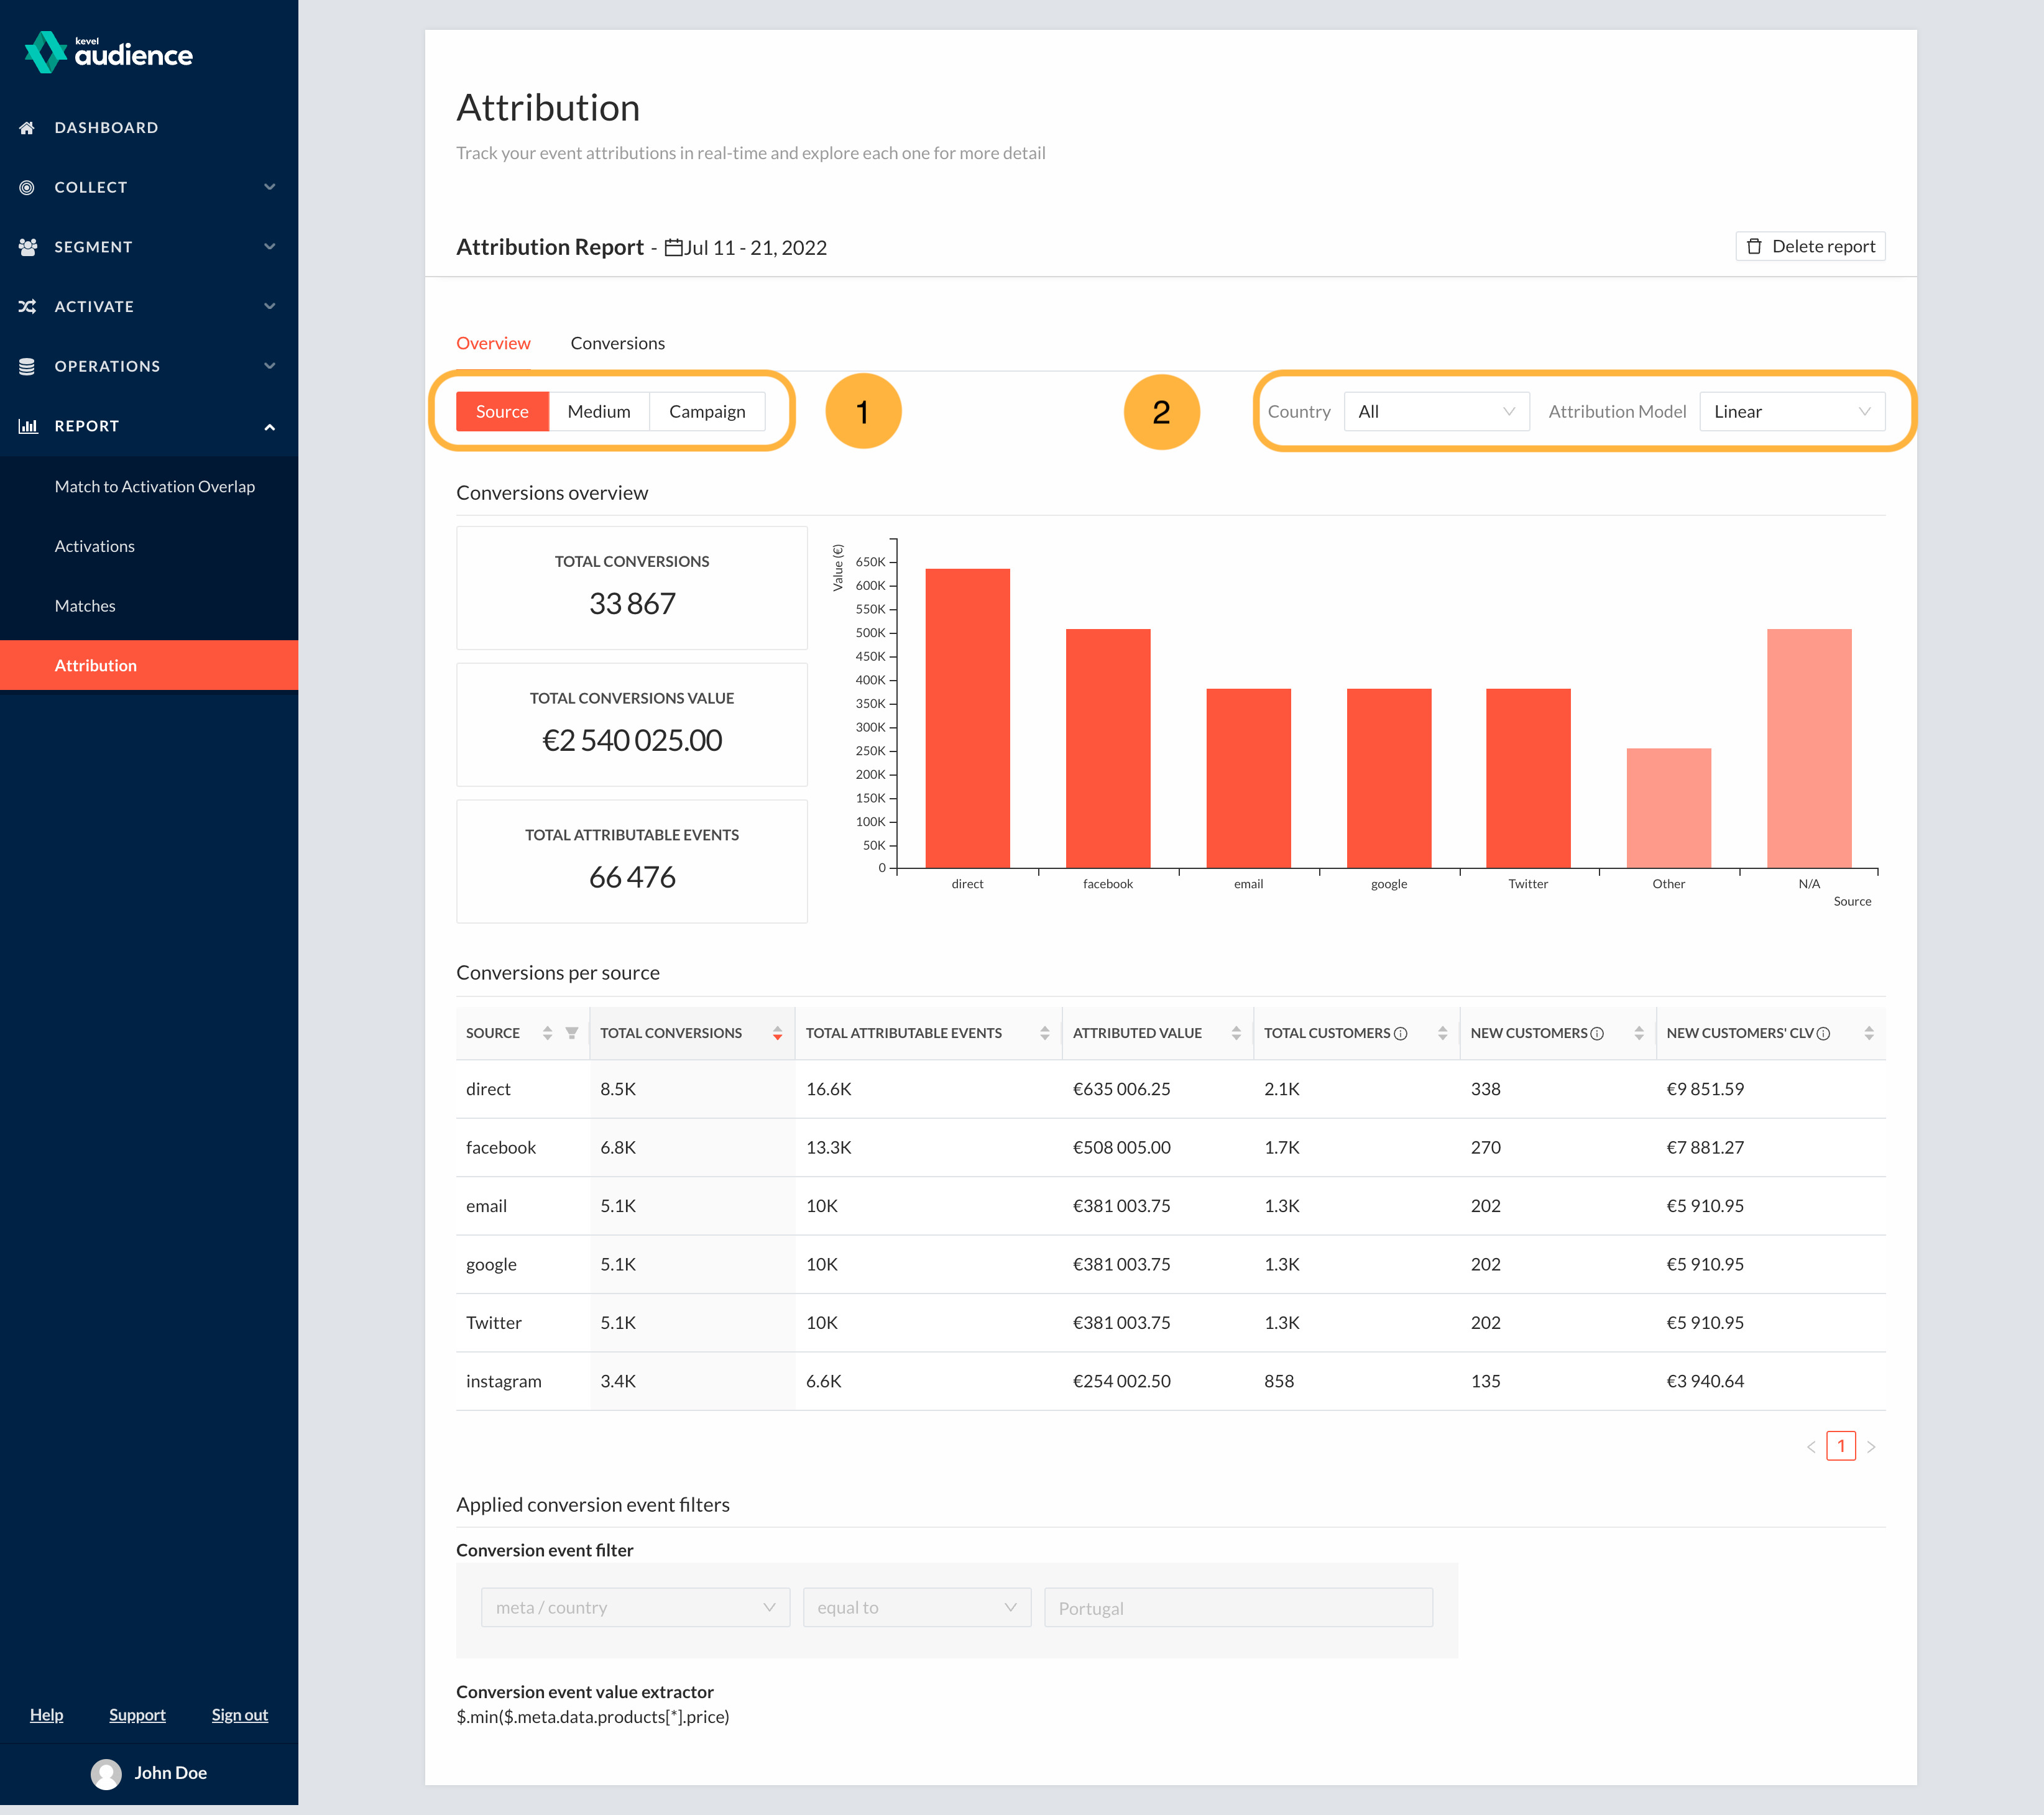
When you open a report, you'll see that each report has two tabs. The first is an Overview tab, which shows the total number of conversions that took place in the given time period, the total value from those conversions, and the total number of attributable events considered relevant to the conversions.
(1)You'll also see the totals broken out by source in bar chart form as well as list below.(2)In the page footer, you can see the conversion event filter and value extractor that were used in the generation of the report.
(3)noteOrder updates are considered when generating attribution reports, taking into consideration the latest order
totalvalues which accounts with order details such as cancelation and refunds.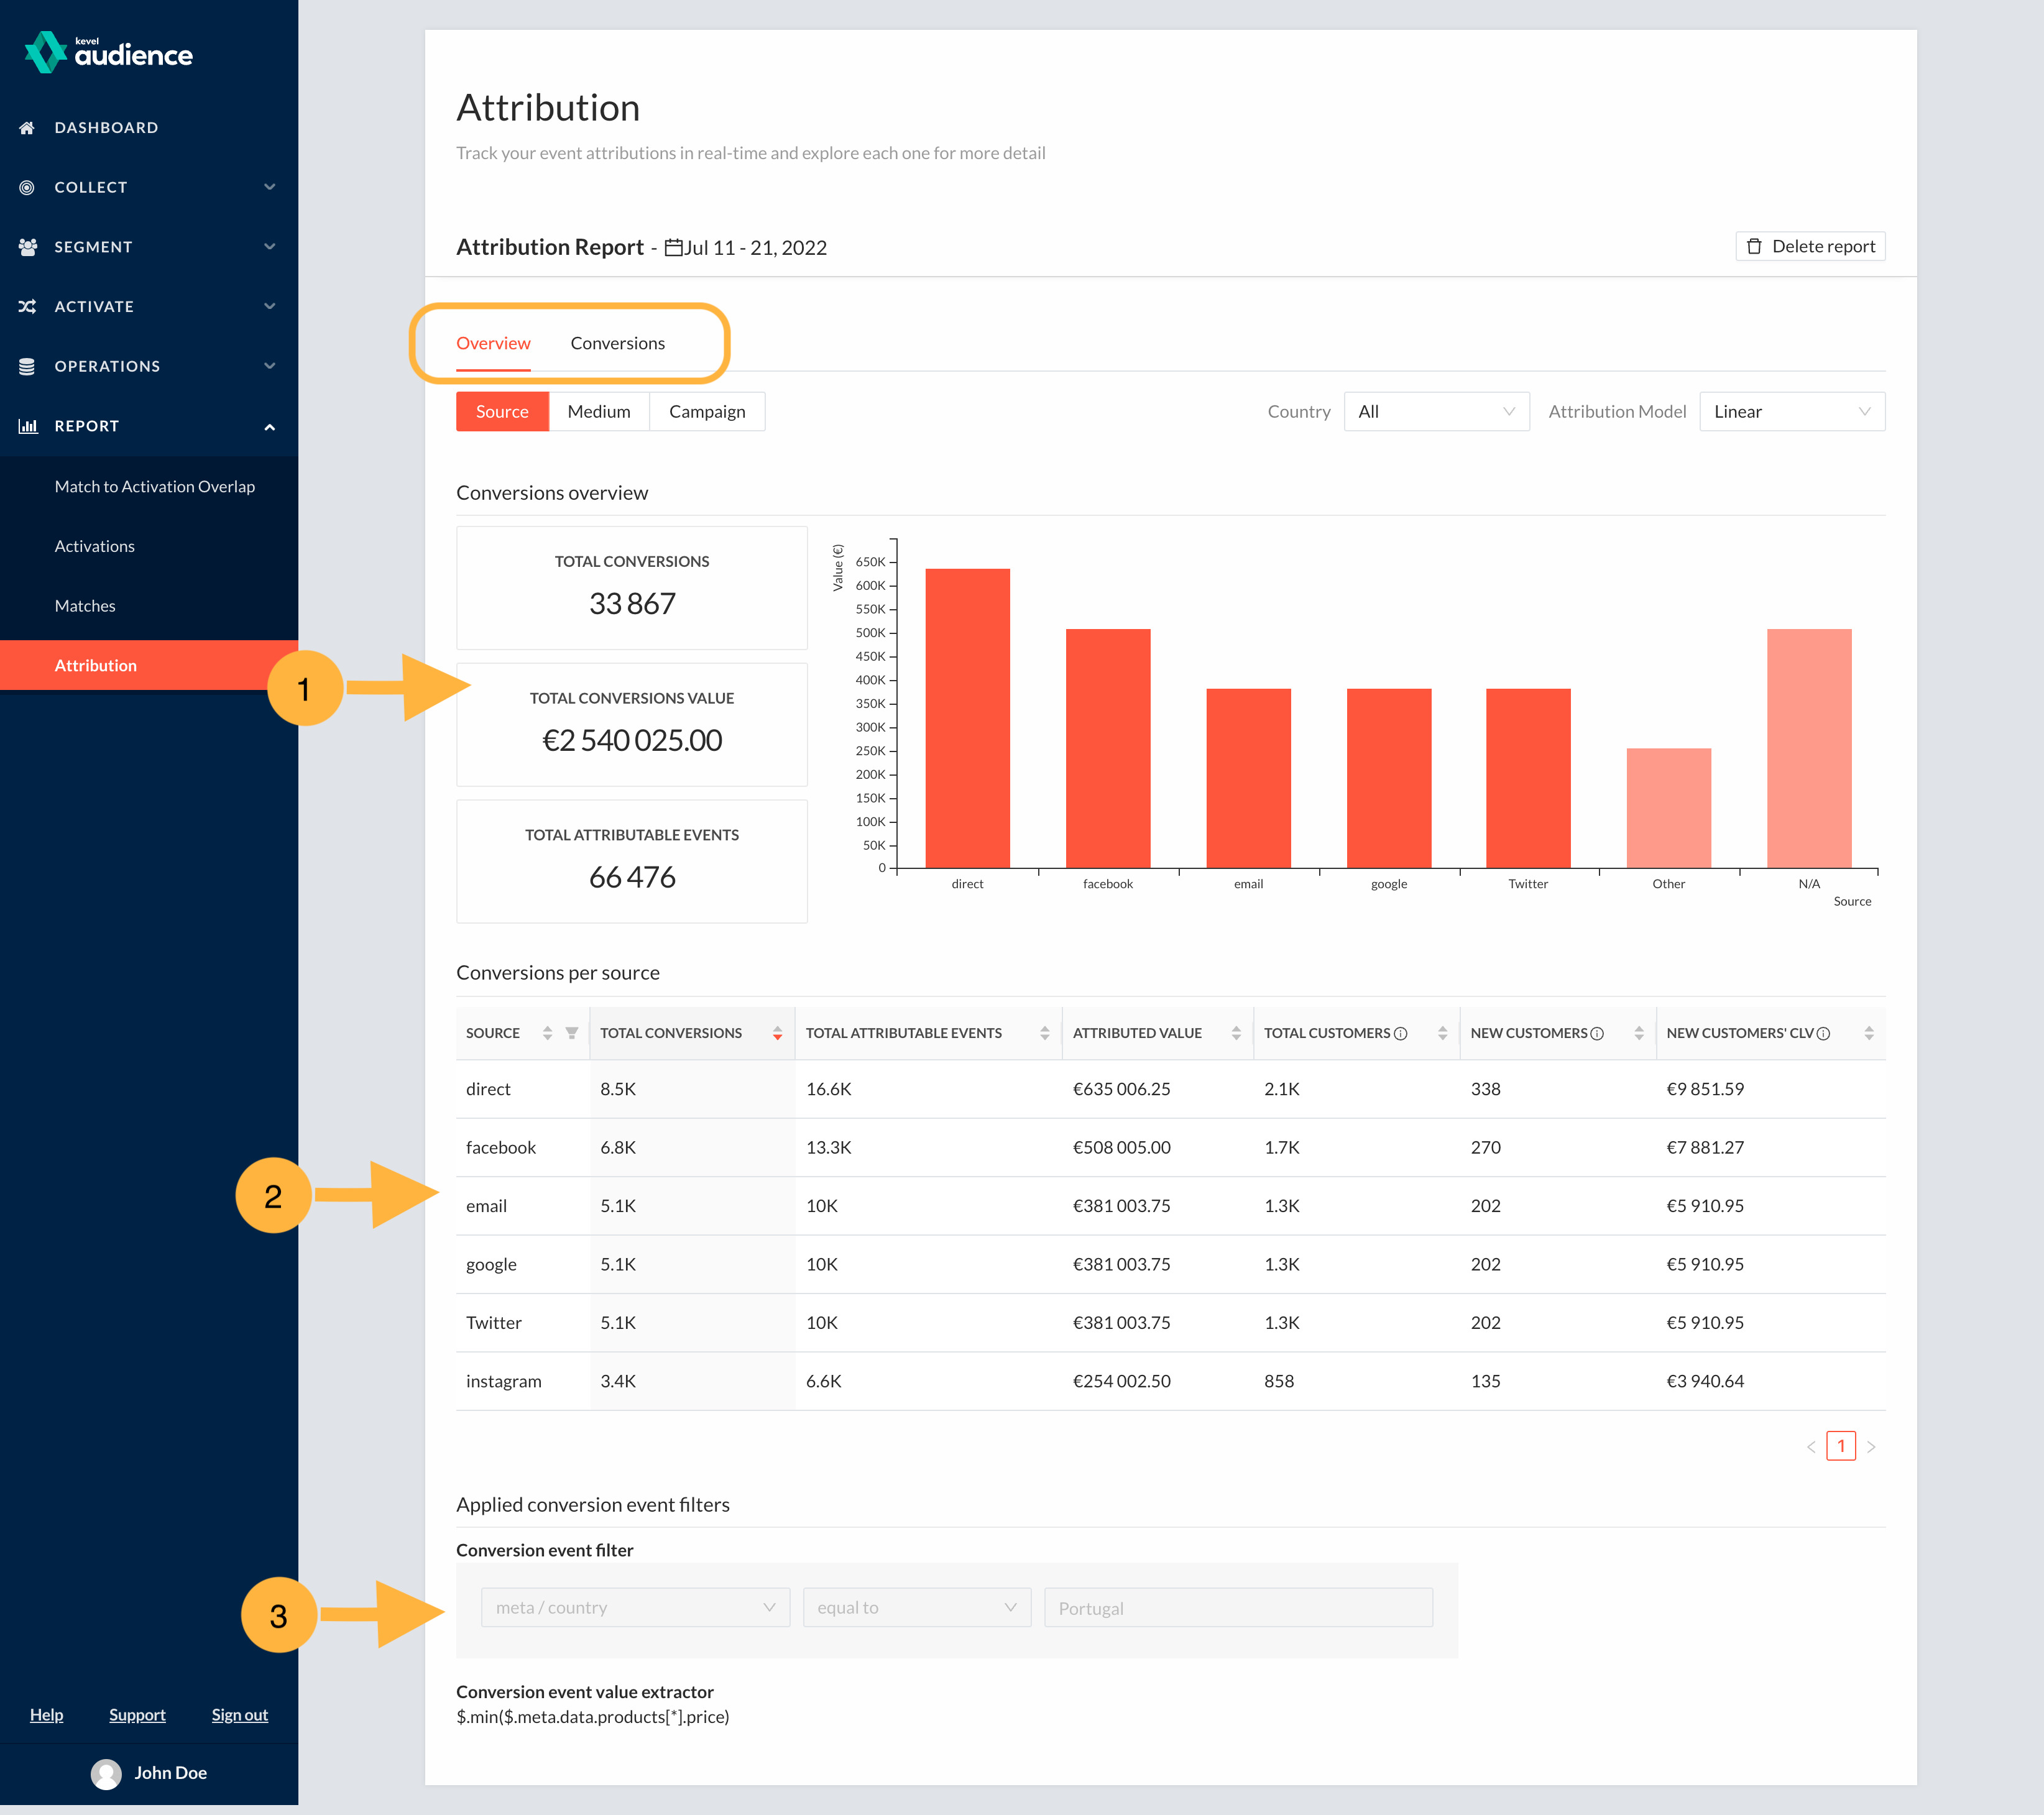
-
Filter the overview report
The Overview can be filtered by source, medium, and campaign,
(1)so you can see the total values attributed at each level. You can also filter the report by country. And you'll see drop-down options to change the attribution model being used.(2)Changing the model will change the values attributed to each source, medium, and campaign. We will go further into the different models below.
 note
noteAs of September 2019, the attribution reports support linear attribution in the client-facing UI. Additional models are forthcoming, with priority given to client requests.
-
Explore the Conversions tab to see attribution for individual transactions
The second tab is a log of conversions that took place in the time frame captured by the report. Click on a conversion to expand and see the full transaction details.
(1)The transaction details include the value, payment details, which promotions were applied if any, and a list of products purchased.
(2)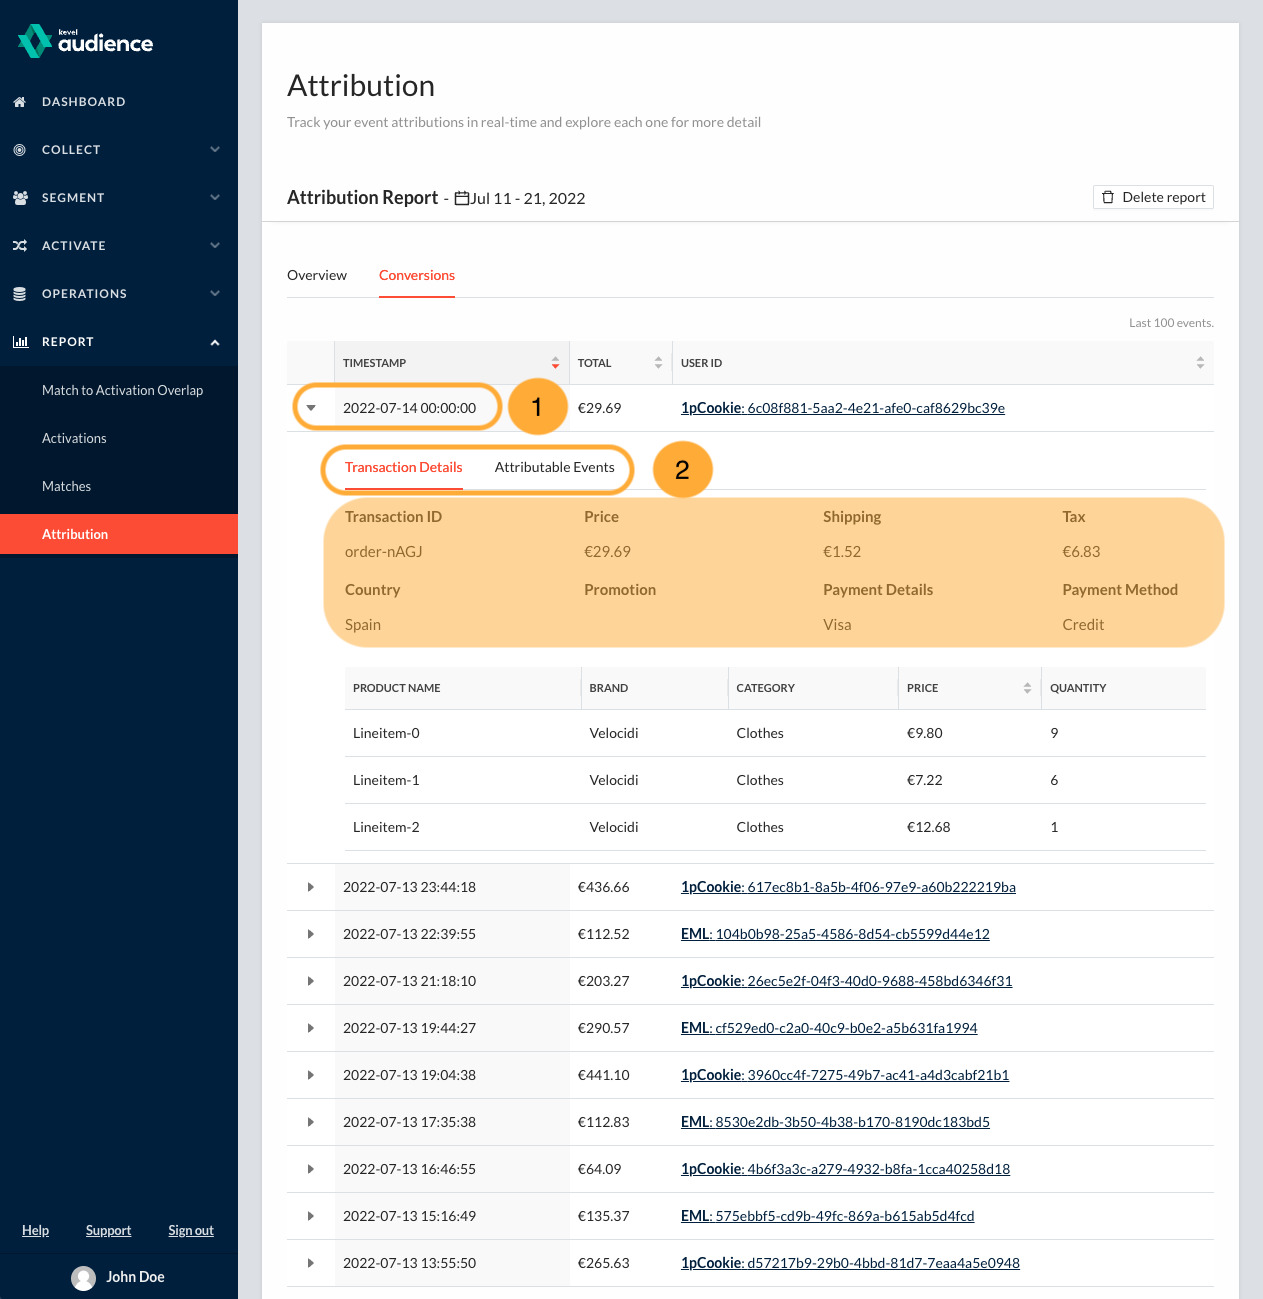
Each conversion also has a list of attributable events that led up to the conversion.
(1)An attributable event is usually a marketing touchpoint that initiates a new session on your website.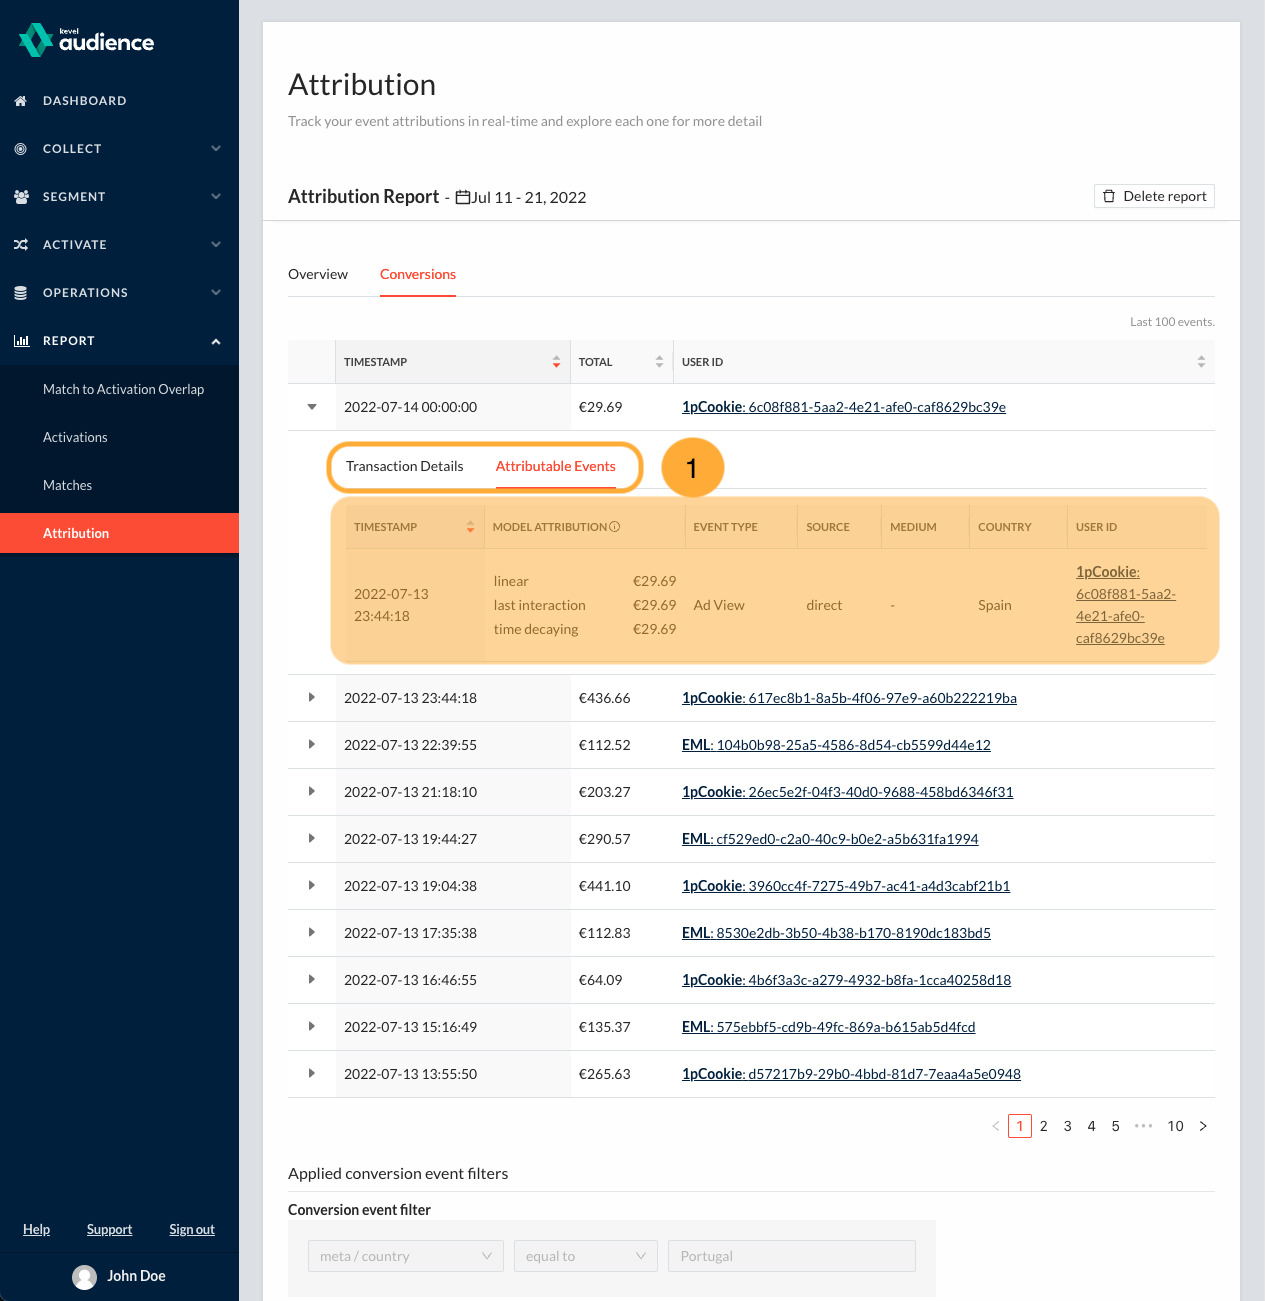
For example, when a customer arrives at your website by clicking on a Facebook ad, it's logged as an attributable event. You'll also be able to switch between the attribution models as you are looking at each conversion, so you can compare the different results.
An Explanation of Linear Attribution
The linear attribution model gives equal weight to each event along the customer journey that led up to the purchase. That means if there are 5 different attributable events recorded, and the value of the end purchase was $50, each event is worth $10.
For example, let's say three of those events are from Facebook, one is from Google, and one is direct. In this case, the report will tell you Facebook generated $30, Google generated $10, and Direct generated $10 worth of revenue for this specific conversion.
This model is helpful to marketers who are trying to get a full picture of all the touchpoints in a customer's journey. In the aggregate view, the linear model will give you a proportionate distribution of how much your customers interact with you on each of your marketing channels.
Additional Attribution Models
Currently, in the pipeline we have plans to incorporate Last Interaction Attribution, Time Decaying Attribution, and Data-driven (custom) Attribution. When they are implemented, you'll be able to switch between models in each report using a drop-down menu, and compare results on both the Overview and the Conversions tabs.
Kevel Audience allows programmatic API access to attributable events for attribution modeling outside our system. This means you can share the data necessary to run attribution with a third party platform, (while still keeping it to only the minimum information), in order to leverage attribution models that are not available through Audience.
The platform also supports custom attribution modeling, for advanced data scientists who want to use their own models.
Events Origin (On the Attribution Report)
Attribution reports are built using the events' origin which is identified as described in Augmenting Collected Events. Kevel Audience supports a list of domains to ignored for attribution purposes, which are to be considered as direct traffic. These can be multiple domains being used by the client, or a list of providers which should not be attributed value to, for example, payment providers.
By default, we'll ignore the domain under which it is deployed and the following payment providers:
- paypal.com
- stripe.com
- square.com
- paylinedata.com
- adyen.com
Additional domains can be added by request to this list.