Navigating the Dashboard
Customer Insights is organized by specific business intelligence areas. The first tab is a welcoming module that provides an overview of all the other tabs. From then on, each tab will be more specific, and focus on several different themes, namely user behavior and attributes, multi-touch attribution, churn analysis and sales performance.
Please note that the illustrations below are simply examples and don't represent any particular client's business.
Intro
Here, users can access a comprehensive overview of the business, structured based on main use cases. The provided screenshot highlights sales key performance indicators. When users interact with the visual, they will be directed to the Orders module, where they can gain additional insight on sales performance.

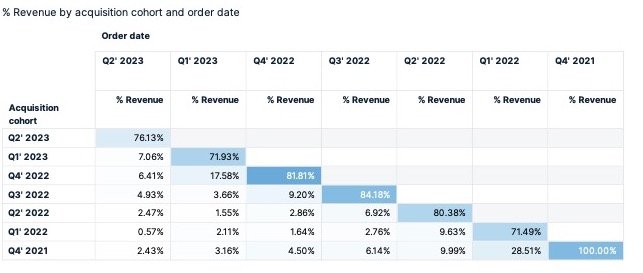
Acquisition Cohort
Within the aquisition section, there are two tabs that make use of different, yet complementary, datasets: users data and line item data. The users data tab primarily focus on user attributes, such as the first and the latest order. It provides a good starting point to gain a general understanding of retention. On the other hand, if the goal is to understand the value driven by a specific acquisition cohort over time, rather than just the value related to the latest order, we recommend exploring the second tab on Acquisition Cohorts.
For illustration purposes, the example below specifically showcases the analysis based on the Users Data dataset.
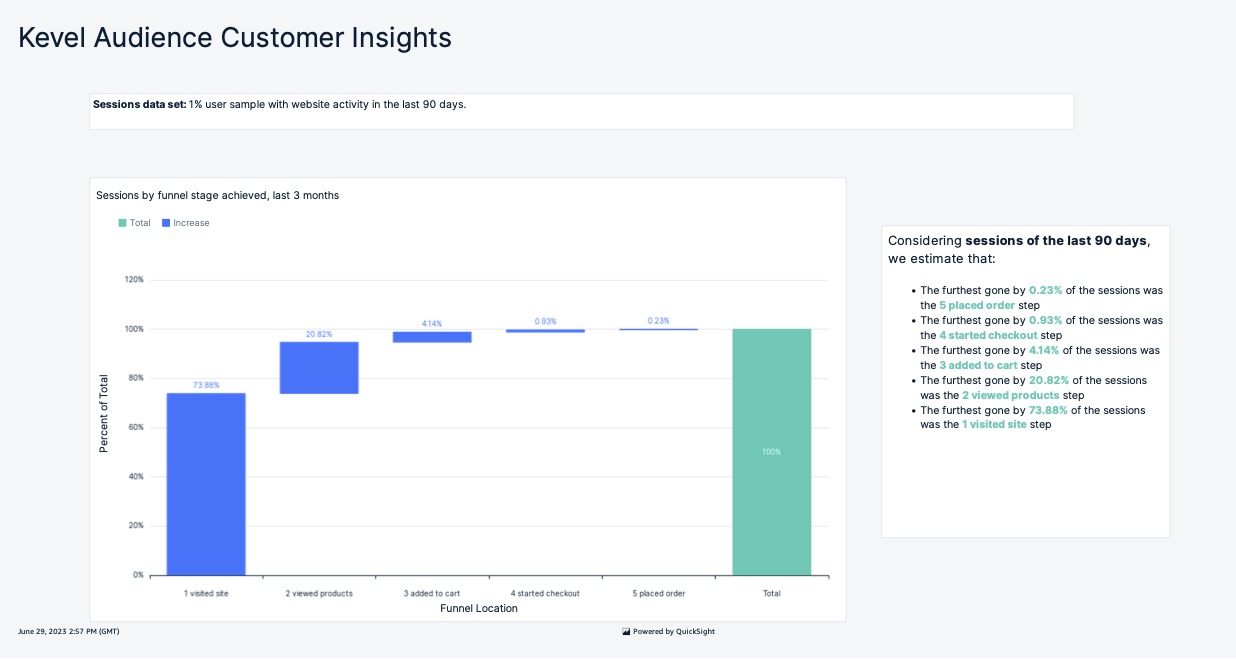
Sessions
In this section, you can find a broad overview of user sessions on the website, focusing on how far users progress in the conversion funnel. It provides valuable insights into the depth of user engagement and highlights their progression through the various stages of the conversion process.
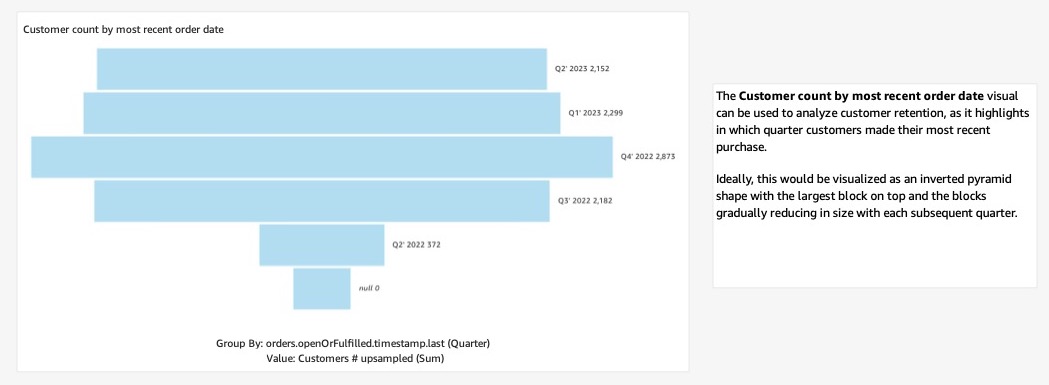
Visitors and Customers
The main focus of this section is on users and their attributes. It provides detailed information about various aspects, including when a users' first add to cart occurred, the value of their last order, estimated date of the next purchase, membership in specific Kevel Audience segments, projected future customer lifetime value (CLV), and more. These user-centric details offer valuable insights into individual customer behavior, preferences, and potential value to the business.
Retention
In this tab, you will find the RFM (Recency, Frequency, Monetary Value) map controls, accompanied by relevant data points and metrics. It enables you to explore and experiment with different RFM settings, offering additional insights not available in the RFM map of the Kevel Audience platform, such as the number of days overdue and lifetime per RFM segment.
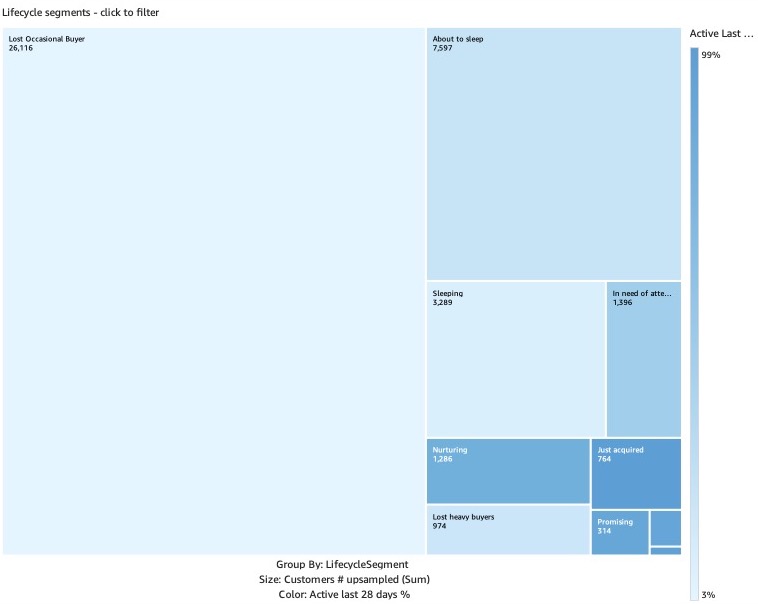
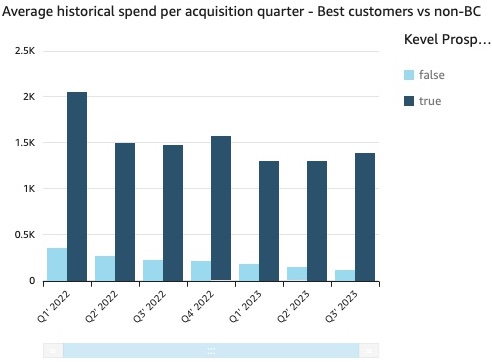
Behavior
In this section, we delve into the default Kevel Audience segments, such as "Best Customers," and examine how they differ from other users. Additionally, we provide general insights on the customer base, such as the duration between a user's first pageview and their initial order.
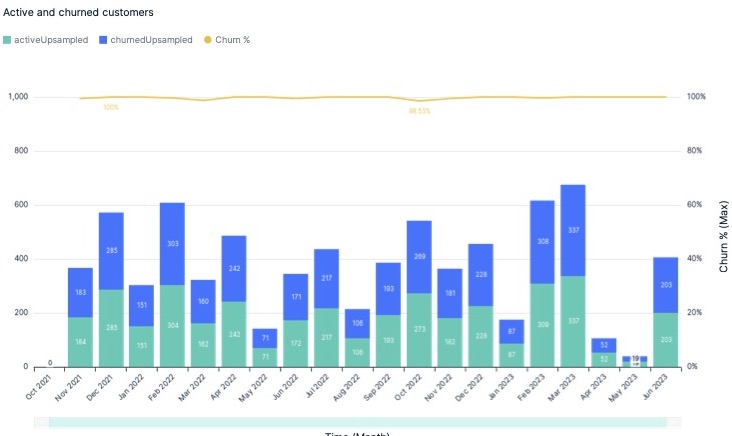
Churn
In this section, we monitor the progression of Churn over time. It is important to note that the definition of "Churn" used in this tab may not be identical to that used in the Retention tab.
For more comprehensive information and specific details, we recommend referring to the Churn dataset for more details.
Attribution
This module consists of two tabs as well. The first tab primarily provides insights into the traffic sources that contribute the most to revenue, new customer acquisition, and other relevant metrics. The second tab focuses on the entire customer journey, offering insights into questions such as channel overlap frequency and the number of touchpoints required for a customer to convert.
The screenshot below refers to the first tab.
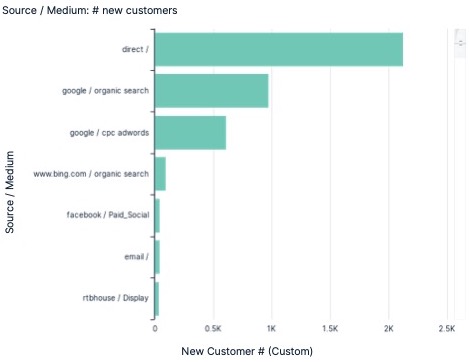
For more information, we encourage users to explore our attribution documentation.
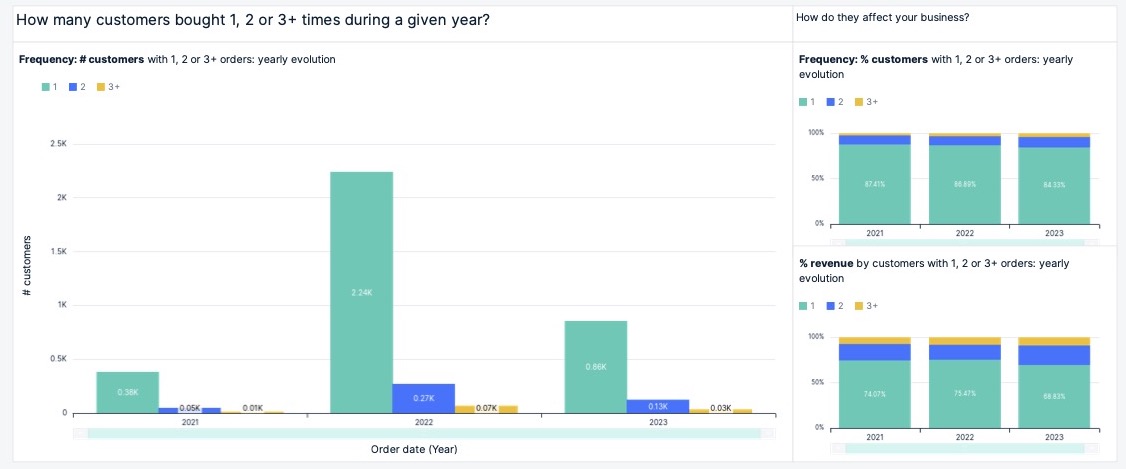
Orders
We have a total of seven tabs dedicated to orders and line items, each focusing on different aspects of the business. The first two tabs provide a comprehensive overview of the business and its latest trends. The example below is one of these tabs. Following that, the subsequent tabs offer a more detailed view on brand, category and product purchased, most frequently used payment and shipping methods, and an analysis on categories bought together. This helps in understanding cross-category purchasing patterns and identifying potential opportunities for cross-selling or upselling
For guidance related to Customer Insights data, refer to Datasets section.